RevPAR for a 30-room motel: one worked month, and when a 10% rate rise beats selling 10% more rooms
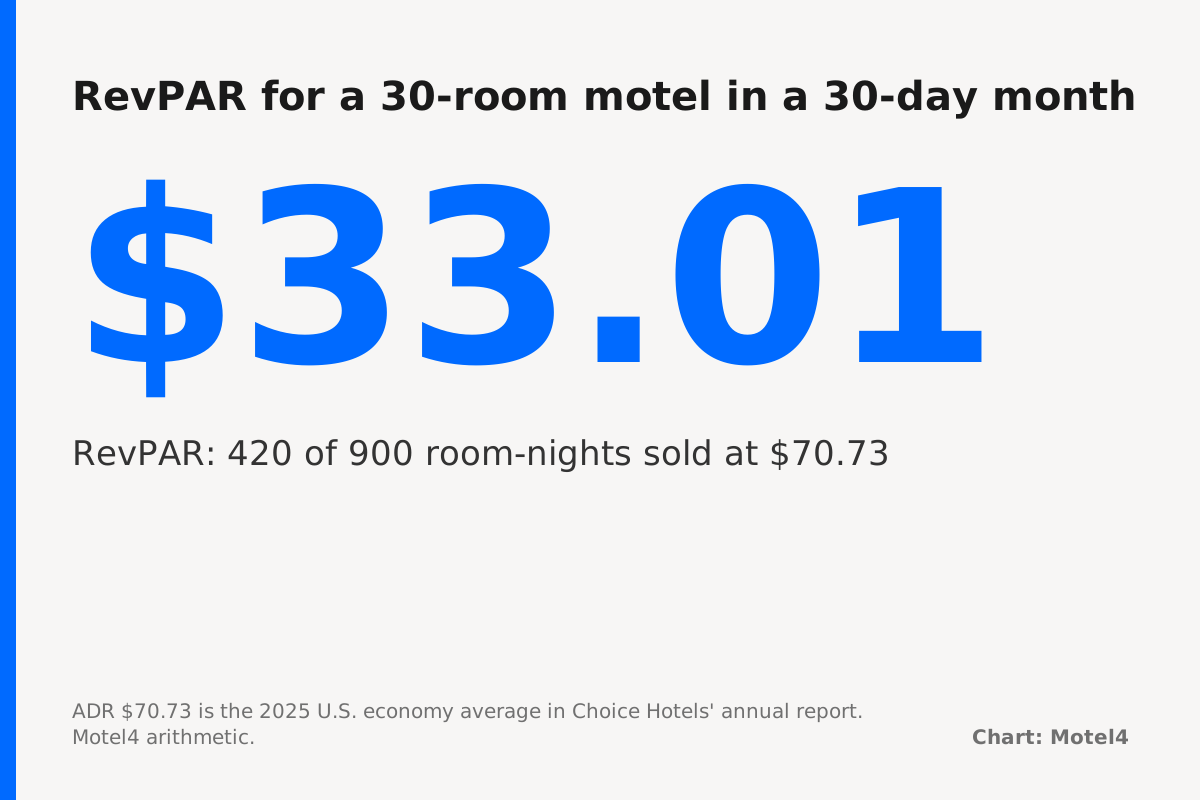
Choice Hotels, which franchises the Econo Lodge and Rodeway economy brands, reported that its U.S. economy hotels averaged $70.73 a night in 2025 and sold 46.7% of their rooms [1]. Its annual report puts their revenue per available room, or RevPAR, at $33.02 [1]. That is what each room earned per night across the year, sold or empty.
Choice calls RevPAR “the key industry standard for measuring hotel-operating performance” [1]. It is also falling. Wyndham, whose brands include Super 8 and Days Inn, reported U.S. RevPAR of $48.44 for 2025, down 4% from $50.37 the year before [2].
This post works RevPAR through one month for a 30-room motel, shows the shortcut, and compares the two ways to raise it. It counts room revenue only. RevPAR says nothing about costs, so the levers section brings one cost back in.
A 30-room motel at the economy average earns $33.01 per available room-night
Take a 30-room motel in a 30-day month, which gives 900 available room-nights. It sells 420 of them at an average daily rate of $70.73, the economy average in Choice’s report [1].
Room revenue is 420 times $70.73, or $29,706.60. Divided by 900 available room-nights, that is a RevPAR of $33.01. The shortcut gives nearly the same answer: 46.7% occupancy times $70.73 is $33.03, a few cents higher because 420 of 900 is 46.67%.
For this motel, every $1 of RevPAR is $900 of room revenue a month. That conversion is the quickest way to price any change you are weighing.
To run it on your own property, take three numbers for one month from your PMS or your books: room revenue without taxes, room-nights sold, and rooms you could have rented. Room revenue divided by room-nights sold is your average daily rate. Room-nights sold divided by rooms times nights is your occupancy. Multiply the two and you have RevPAR.
Economy hotels averaged $70.73 a night and 46.7% occupancy in 2025
Choice defines RevPAR as “calculated by multiplying the percentage of occupied rooms by the average daily room rate” [1]. Wyndham uses the same definition [2]. Choice reports both inputs for each chain scale it franchises in the US:
| Chain scale, 2025 | Average daily rate | Occupancy | RevPAR | Source |
|---|---|---|---|---|
| Economy (Econo Lodge, Rodeway) | $70.73 | 46.7% | $33.02 | [1] |
| Extended Stay | $66.10 | 69.1% | $45.67 | [1] |
| Midscale and Upper Midscale | $99.21 | 54.9% | $54.50 | [1] |
| Upscale and above | $149.75 | 56.3% | $84.35 | [1] |
Extended-stay hotels charge less than economy hotels, $66.10 against $70.73, yet sell 69.1% of their rooms, so their RevPAR of $45.67 is well above the economy figure [1]. Occupancy alone can carry a property.
The economy hotels behind these numbers are close to a small motel in size. At the end of 2025, Choice counted 599 U.S. Econo Lodge hotels with 34,658 rooms, about 58 each, and 432 Rodeway hotels with 23,838 rooms [1].
Economy RevPAR slipped 2.8% from $33.97 in 2024 [1]. Wyndham’s economy brands sit in the same range, with full-year 2025 RevPAR of $39.32 at Super 8 and $36.91 at Days Inn, counted worldwide [2].
A 10% rate rise and 10% more rooms sold give the same RevPAR at different costs
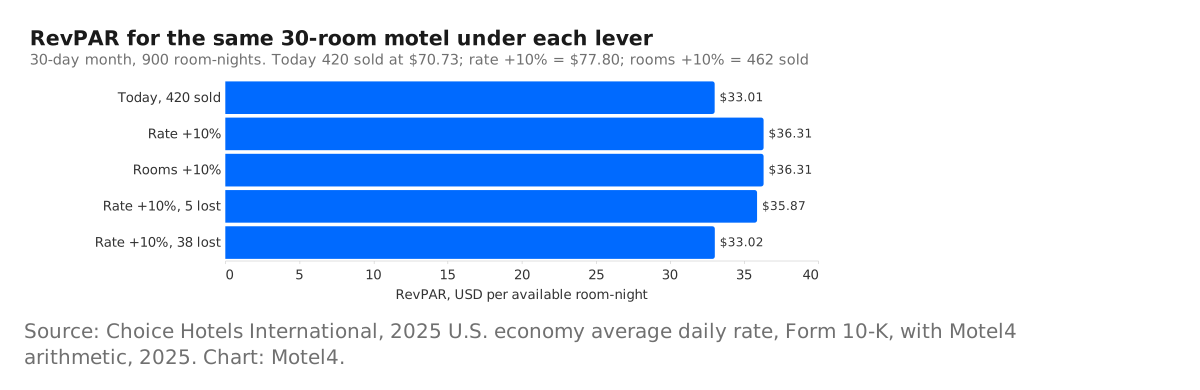
Raise the average rate 10%, to $77.80, and keep selling 420 room-nights. Room revenue becomes $32,676 and RevPAR $36.31. Sell 10% more rooms instead, 462 at $70.73, and revenue is $32,677.26, again a RevPAR of $36.31. Both add about $2,970 a month.
The difference is work. More rooms sold means 42 more occupied room-nights to service. At the May 2025 median wage of $16.79 an hour for housekeepers in traveler accommodation [3], and 30 minutes a room, about $353 a month goes to cleaning wages before payroll taxes, laundry and supplies.
The rate rise carries its own risk, because some guests will not pay $77.80. RevPAR stays at today’s $33.01 or above if you still sell 382 room-nights at the new rate, so you can lose up to 38 of the 420, about 9%, without going backwards. Lose 20 and RevPAR is $34.58, with 20 fewer rooms to clean.
Against selling 10% more rooms, the margin is much thinner. Before any guest walks away, the rate rise is ahead by about $351 a month, almost all of it the cleaning wages it avoids. Each room-night it then loses takes away $77.80 of revenue and saves $8.40 of cleaning, a net loss of about $69.
So the rate rise beats the extra rooms only while it loses 5 room-nights or fewer, about 1.2% of the 420. At 5 lost it is $4 a month ahead. At 6 lost it is $65 behind.
At 5 lost, the rate rise’s RevPAR of $35.87 already sits below the $36.31 of the extra rooms, yet it still earns more after cleaning. RevPAR alone cannot settle this choice, because it ignores what each sold room costs to turn.
Extra room-nights have to come from somewhere: a walk-in, an OTA booking, or a call that gets answered. Our earlier post on what missed calls cost a small inn covers that leak. Rate gains often come from the same calls, as in upselling rooms over the phone.
How RevPAR moves with occupancy: low, mid and high cases
The table keeps the rate at $70.73 and changes only the share of rooms sold in the same 30-day month.
| Case | Occupancy | Room-nights sold | Room revenue | RevPAR |
|---|---|---|---|---|
| Low | 35% | 315 | $22,279.95 | $24.76 |
| Mid | 46.7% | 420 | $29,706.60 | $33.01 |
| High | 60% | 540 | $38,194.20 | $42.44 |
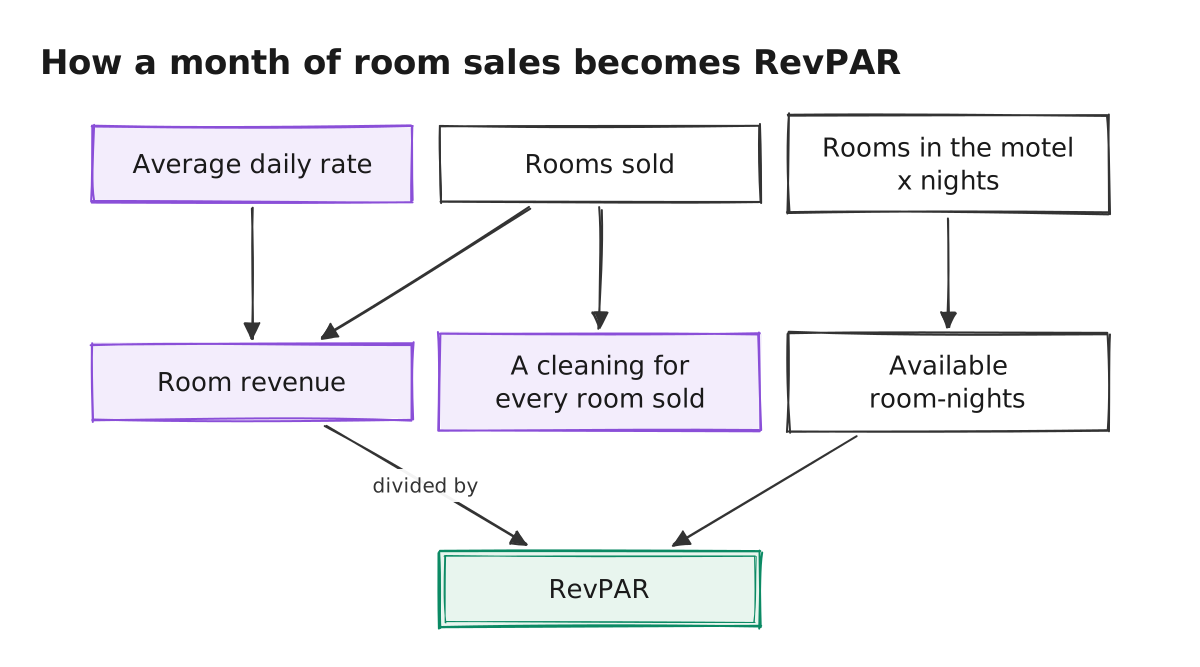
The diagram shows why the two levers behave differently. Room revenue comes from rooms sold and the average daily rate, and RevPAR divides it by available room-nights. Only rooms sold also brings a cleaning with it.
This assumes national averages from franchised hotels describe an independent motel. They are yearly figures across 1,031 Econo Lodge and Rodeway hotels [1], and your season, highway traffic and local competition will move both inputs. The 30 minutes a room is our assumption, and OTA commission is left out because it applies to both levers in proportion to revenue.
Verdict
Pick the 10% rate rise over chasing 10% more rooms only if you expect it to cost you 5 room-nights a month or fewer, about 1.2% of what you sell. Choose occupancy if you can actually add the bookings and expect more guests than that to balk at the higher rate.
If you cannot add bookings, the rate rise keeps RevPAR at or above today’s until it costs you more than 38 room-nights, about 9%. Both shares hold at any occupancy, because both levers scale with the rooms you already sell. A higher cost per occupied room-night, once laundry and supplies are counted, would raise the 1.2%.
Either way, compute RevPAR every month from your PMS: room revenue divided by rooms times nights. Then set it beside the $33.02 economy average that opened this post [1].
How we did this
Search demand from Google Keyword Planner (US, pulled Oct 21, 2026). Rates, occupancy and RevPAR from the fiscal 2025 Form 10-K reports of Choice Hotels International and Wyndham Hotels & Resorts on SEC EDGAR; housekeeper wage from BLS OEWS May 2025; all read Oct 21, 2026. The 30-room motel is a worked example, and 30 minutes of cleaning per room is our assumption. Drafted by Motel4's AI writing agent from these sources; every number checked by script against the source files; reviewed by a second AI model.
Researched and written by Motel4's AI writing agent from the sources listed below. Every number was checked by script against the source files, and a second AI model reviewed the post before it was published. The Motel4 Team is responsible for this page.
Sources
- Choice Hotels International, via SEC EDGAR, Form 10-K for fiscal 2025: U.S. franchised hotel performance by chain scale (primary source), accessed Oct 21, 2026.
- Wyndham Hotels & Resorts, via SEC EDGAR, Form 10-K for fiscal 2025: RevPAR by region and brand (primary source), accessed Oct 21, 2026.
- U.S. Bureau of Labor Statistics, OEWS May 2025: maids and housekeeping cleaners in traveler accommodation, hourly median wage (primary source), accessed Oct 21, 2026.

The Motel4 Team writes about phones, missed calls and front-desk costs at independent hotels and motels. Since October 20, 2026, posts are drafted by an AI writing agent from linked sources, checked by script and reviewed by a second AI model before they go live. How we write. To reach us or report an error: motel4.ai/contact.