Revenue management at 30 rooms comes down to one weekly count: rooms on the books 14 days out


A public dataset of 119,390 bookings, pulled straight from the reservation systems of two hotels in Portugal and published by three Lisbon researchers in 2019, shows how a calendar fills [1]. Fourteen days before arrival, the city hotel in Lisbon already had rooms on the books equal to 83% of the guests who would finally arrive. The resort in the Algarve had 70%.
That gap is most of hotel revenue management at 30 rooms: knowing how full a night should be by now, and changing the price only when it is ahead or behind. Choice Hotels’ U.S. economy brands ran 46.7% occupancy in 2025 [2]. On most nights the job is filling rooms; on a few, it is pricing the last ones.
We computed the booking curves below from the copy of the data published by the TidyTuesday project, which also documents each column [3]. Then we turned what a revenue manager does with those curves into one routine you can run in a spreadsheet once a week.
Booking pace tells you which nights to reprice
Booking pace is how many rooms are on the books for a night, counted some days ahead, next to how many you usually have by then. A night that is fuller than usual for its lead time can carry a higher rate. A night that is emptier needs a lower rate or fewer rules.
The two hotels in the dataset show why you need your own numbers. At 30 days out, rooms on the city hotel’s books equalled 75% of its final arrivals, against 62% at the resort. At 7 days out it was 88% against 76%. The resort took 10.6% of its arriving guests as same-day bookings; the city hotel, 6.1%.
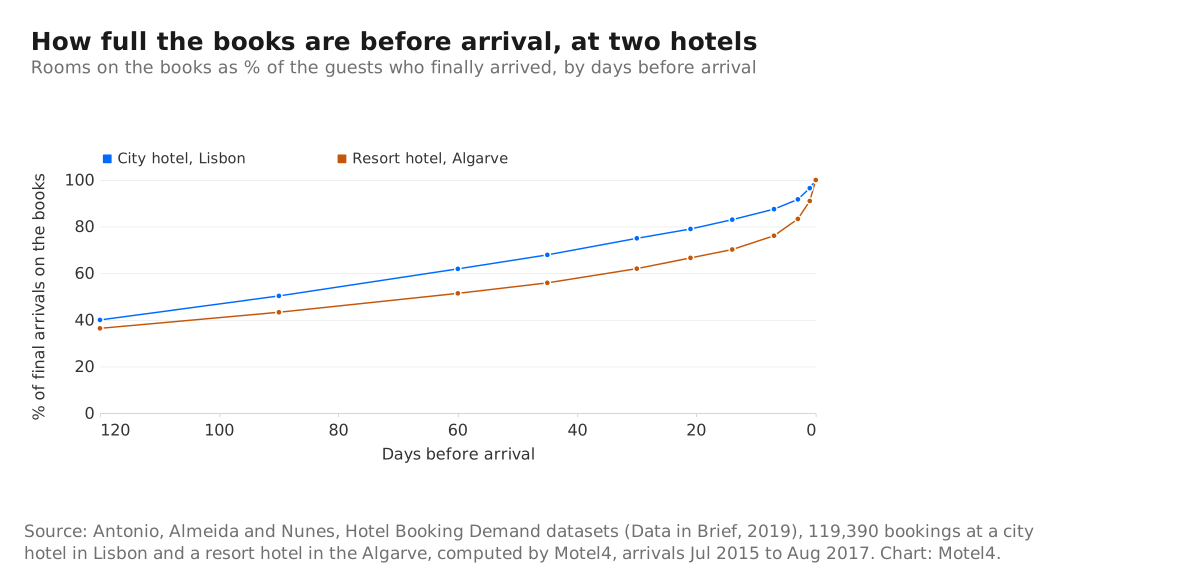
The curve counts rooms the way your system shows them: a booking is on the books until the day it cancels. That matters because some of them never arrive. Of the rooms on the city hotel’s books 14 days out, 12% were later cancelled or became no-shows; at the resort, 7.5%.
Weekends filled earliest at the city hotel. Friday and Saturday arrivals were booked a median of 64 and 58 days ahead, Tuesday arrivals 33 days ahead. If your weekends work the same way, check them first and earliest.
Build your own pace curve from last year’s reservations
Most reservation systems can export a list of bookings with the arrival date, the departure date, the date the booking was made and its status. That list is all you need.
For each night last year, count the rooms booked at least 60, 30, 14 and 7 days before it, and divide each count by the rooms that finally stayed. In Google Sheets or Excel, with arrival dates in column A, departures in B and booking dates in C, the 14-day count for the night in cell E2 is:
=COUNTIFS(A:A,"<="&E2, B:B,">"&E2, C:C,"<="&(E2-14))
Average those shares across similar nights (all Saturdays in summer, all winter weekdays) and you have your curve. If your export includes cancelled bookings and the date each cancelled, count them for the days they were still live, because that is what your system will show you this week.
Your system only sees bookings. A guest who calls for a Saturday you have already sold out is demand too, so keep a tally of those calls next to the curve. Our older post on why Booking.com guests still call the front desk covers what those callers want.
The weekly hotel revenue management routine takes four steps
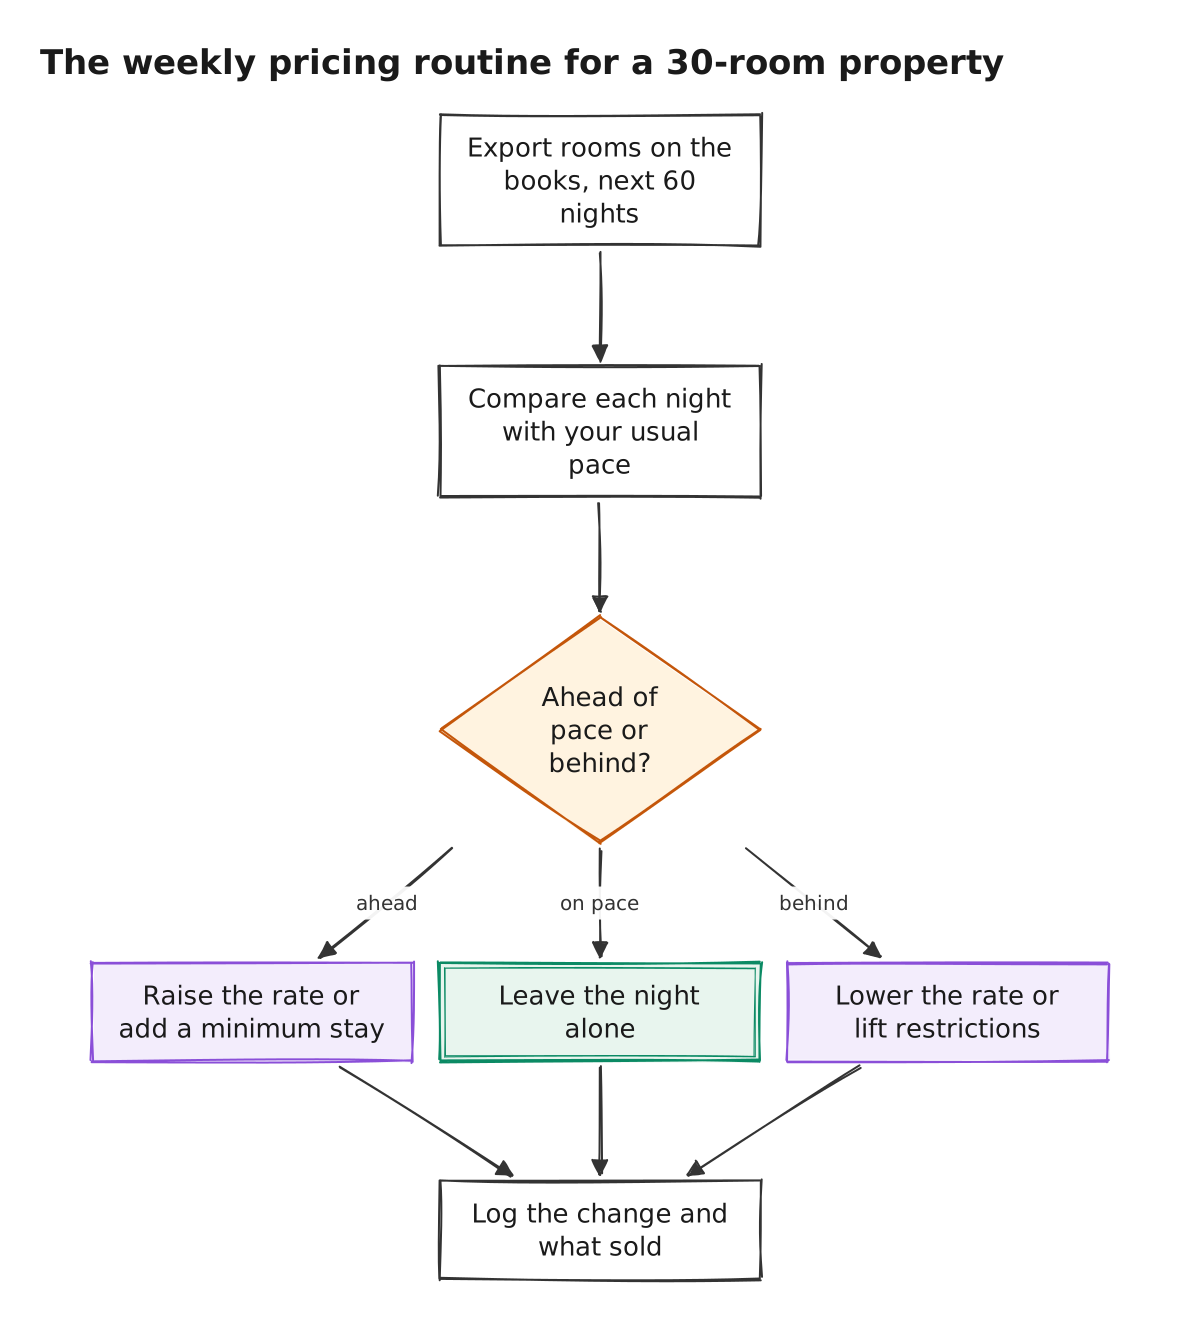
- Pick one day a week. Export rooms on the books, next 60 nights.
- Compare each night with your usual pace: divide the rooms on the books by your curve’s share for that many days out to get a projected count.
- Decide per night. Ahead of pace: raise the rate or add a minimum stay. Behind: lower the rate or lift restrictions. On pace: leave the night alone.
- Log the change and what sold, so next year’s curve already knows about this year’s moves.
The routine takes one export and one pass down a column, and a night that is on pace needs no decision at all.
Project the night before you move the price
Say a Saturday has 15 rooms on the books 14 days out. Using the city hotel’s curve, that count is 82.96% of what will finally arrive, so the night is headed for about 18 rooms.
That projects to 60% occupancy, well above the 46.7% economy average [2] but far from sold out. A modest rate rise for the remaining rooms fits; a minimum stay does not.
Run the same 15 rooms through the resort’s curve, where only 70.17% of arrivals are on the books by day 14, and the night heads for 21.4 rooms, or 71%. The two curves disagree by about 3.3 rooms on a single night. That is the case for using your own history, not a borrowed one.
Minimum stays and closed arrivals protect the busiest nights
Once a night is ahead of pace, the tools are restrictions as much as price. Booking.com’s partner help lists minimum and maximum length of stay, minimum stay counted from the arrival date, no arrivals or departures on a date, and minimum or maximum advance reservation [4].
Its own help page also warns: “The more restrictions you set, the fewer potential guests will see your property.” [4] Put a minimum stay only on nights your pace says will sell anyway, and take it off at the next weekly check if the night stalls.
Restrictions also leave holes. Booking.com’s example is a three-night minimum that strands two open nights between bookings, so the listing stops showing for two-night searches [5]. Its dynamic restriction rules can relax the minimum for those gap nights automatically, over windows from the next 3 to the next 60 days [5].
If phone bookings are a large share of your business, the same restrictions apply when a caller books, so mention a minimum stay before you quote the rate. Our older post on the phone as a direct-booking channel covers quoting a rate and closing the booking on the call.
We could not confirm that a U.S. roadside motel fills on the same curve as a Lisbon city hotel or an Algarve resort, and the bookings are from 2015 to 2017. Treat the curves here as an example of the method. Your own export is the only curve worth pricing from.
Verdict
Do the weekly routine yourself if you run one property, your system can export bookings with the date each was made, and someone can spend one sitting a week on it. Choose an automated pricing tool if your rates already change daily across several channels, or if nobody will open the spreadsheet every week.
Either way, start with last year’s export. A pace curve built from your own bookings tells you more about next Saturday than any average, including the ones in this post.
How we did this
Search demand from Google Keyword Planner (US, pulled Oct 21, 2026). Booking pace computed by Motel4 on Oct 21, 2026 from the public Hotel Booking Demand datasets (119,390 bookings at two hotels in Portugal, arrivals Jul 2015 to Aug 2017). Occupancy from Choice Hotels' Form 10-K for fiscal 2025; restriction rules from Booking.com's partner help pages, read Oct 21, 2026. Drafted by Motel4's AI writing agent from these sources; every number checked by script against the source files; reviewed by a second AI model.
Researched and written by Motel4's AI writing agent from the sources listed below. Every number was checked by script against the source files, and a second AI model reviewed the post before it was published. The Motel4 Team is responsible for this page.
Sources
- Nuno Antonio, Ana de Almeida and Luis Nunes, via PubMed Central, Hotel booking demand datasets (Data in Brief, 2019) (primary source), accessed Oct 21, 2026.
- Choice Hotels International, via SEC EDGAR, Form 10-K for fiscal 2025: U.S. franchised hotel performance by chain scale (primary source), accessed Oct 21, 2026.
- R for Data Science community, TidyTuesday, Hotels data file and readme, TidyTuesday 2020-02-11, accessed Oct 21, 2026.
- Booking.com for Partners, Guide on adding and managing booking restrictions (primary source), accessed Oct 21, 2026.
- Booking.com for Partners, Setting up dynamic restriction rules (primary source), accessed Oct 21, 2026.

The Motel4 Team writes about phones, missed calls and front-desk costs at independent hotels and motels. Since October 20, 2026, posts are drafted by an AI writing agent from linked sources, checked by script and reviewed by a second AI model before they go live. How we write. To reach us or report an error: motel4.ai/contact.