Hotel and motel pay rose 37.8% from 2019 to 2025 while the industry kept 111,545 fewer jobs
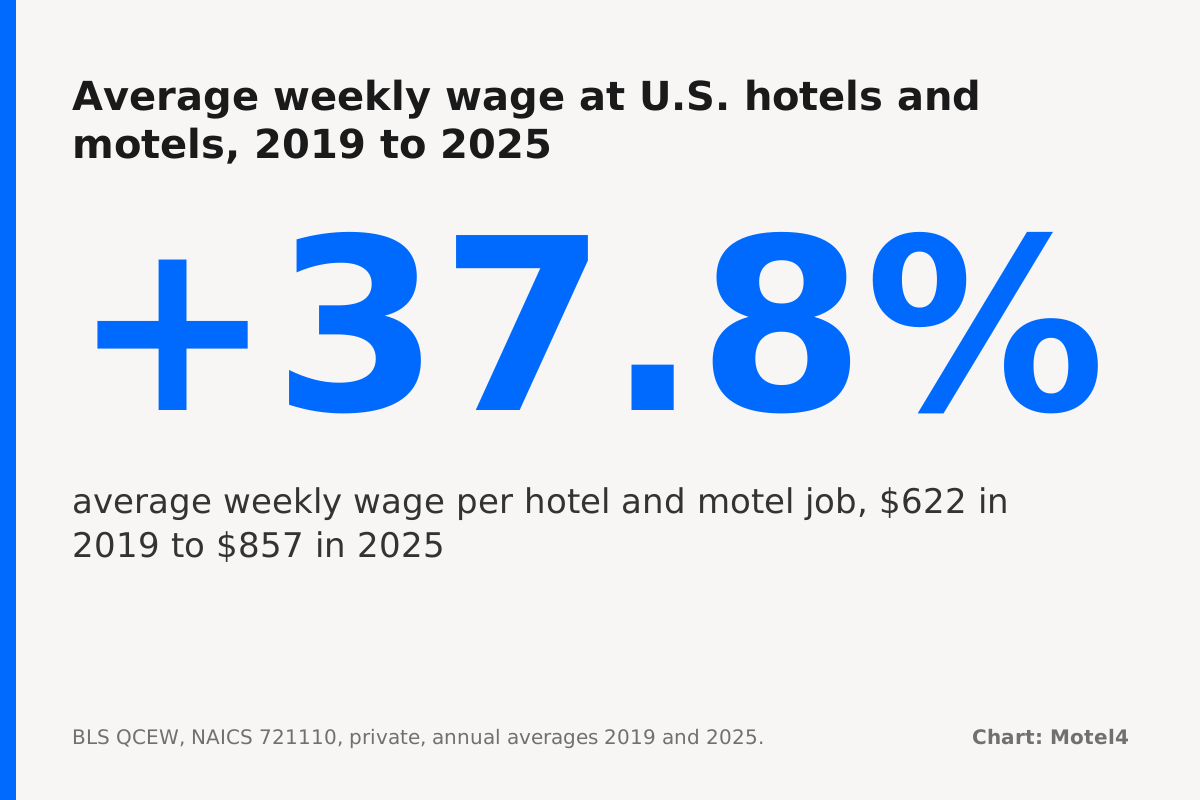
The average job at a private US hotel or motel paid $857 a week in 2025, up 37.8% from $622 in 2019, according to the Bureau of Labor Statistics’ Quarterly Census of Employment and Wages [1]. Over the same six years the industry ended up with 111,545 fewer jobs, even though it had 4,291 more properties [1].
Those are the hotel industry statistics that reach a small owner’s payroll. The federal series are free to check, and nobody is selling anything with them. Below is what changed since 2019, what it adds to a small motel’s wage bill, and how to find your own state’s figure.
Hotel industry statistics since 2019: pay is up, jobs are down
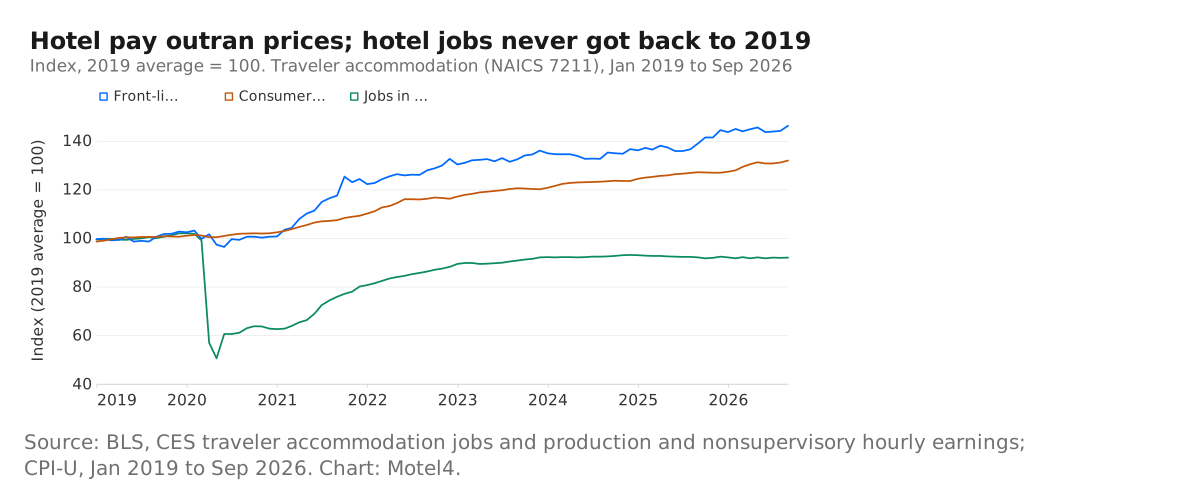
The monthly Current Employment Statistics survey tells the same story with fresher numbers. Traveler accommodation, the federal group that holds hotels, motels and casino hotels, had about 1.85 million jobs in September 2026, seasonally adjusted and preliminary [2]. That is about 160,700 fewer than in September 2019, an 8% drop [2].
Pay moved the other way. Production and nonsupervisory workers in traveler accommodation, the staff below the supervisor level, averaged $22.61 an hour in September 2026, against $15.56 in September 2019 [3]. That is a 45.3% rise in seven years, or 38.2% if you compare the full-year averages for 2019 and 2025.
Consumer prices rose 31.2% between the same two Septembers [4], and average hourly pay across all private industry rose 34.4% [5]. So a front-line hotel hour costs more today even after inflation, and it gained on other jobs. Hours per worker barely moved: 30.58 a week across 2019 and 30.65 across 2025 [3].
The two biggest jobs behind those averages are housekeeping and the front desk. Across the accommodation subsector, BLS counted 420,800 maids and housekeeping cleaners and 247,700 hotel, motel and resort desk clerks in 2025, the two largest occupations on its list [6].
More properties, fewer workers in each one
The annual QCEW counts come from employers’ unemployment-insurance filings and split hotels and motels from casino hotels [1]. Private hotels and motels, the code that leaves out casino hotels, had 57,327 establishments and 1,659,783 jobs in 2019, and 61,618 establishments and 1,548,238 jobs in 2025 [1].
That works out to about 29 jobs per property in 2019 and 25.1 in 2025 [1]. The data cannot say whether new, smaller properties or leaner existing ones made the difference; both produce the same average.
Casino hotels are counted on their own for a reason. Their 2025 average was $1,023 a week, with about 601 jobs per establishment [1]. Any traveler accommodation figure that mixes them in, including the monthly series above, is pulled up by them.
What the raise since 2019 costs a small motel: about $79,400 a year
Take a motel that pays for 240 staff hours a week, roughly six full-time people. That figure is our assumption; replace it with your paid hours per week from your payroll report. Front-line pay averaged $15.48 an hour across 2019 and $21.39 across 2025, our averages of the 12 monthly BLS values [3].
The $5.91 difference, times 240 hours, times 52 weeks, is about $73,757 a year. Employers also pay 6.2% Social Security and 1.45% Medicare tax on wages [7]. Add employer FICA of 7.65% and your yearly payroll increase comes to $79,399, before state unemployment tax, workers’ compensation or benefits.
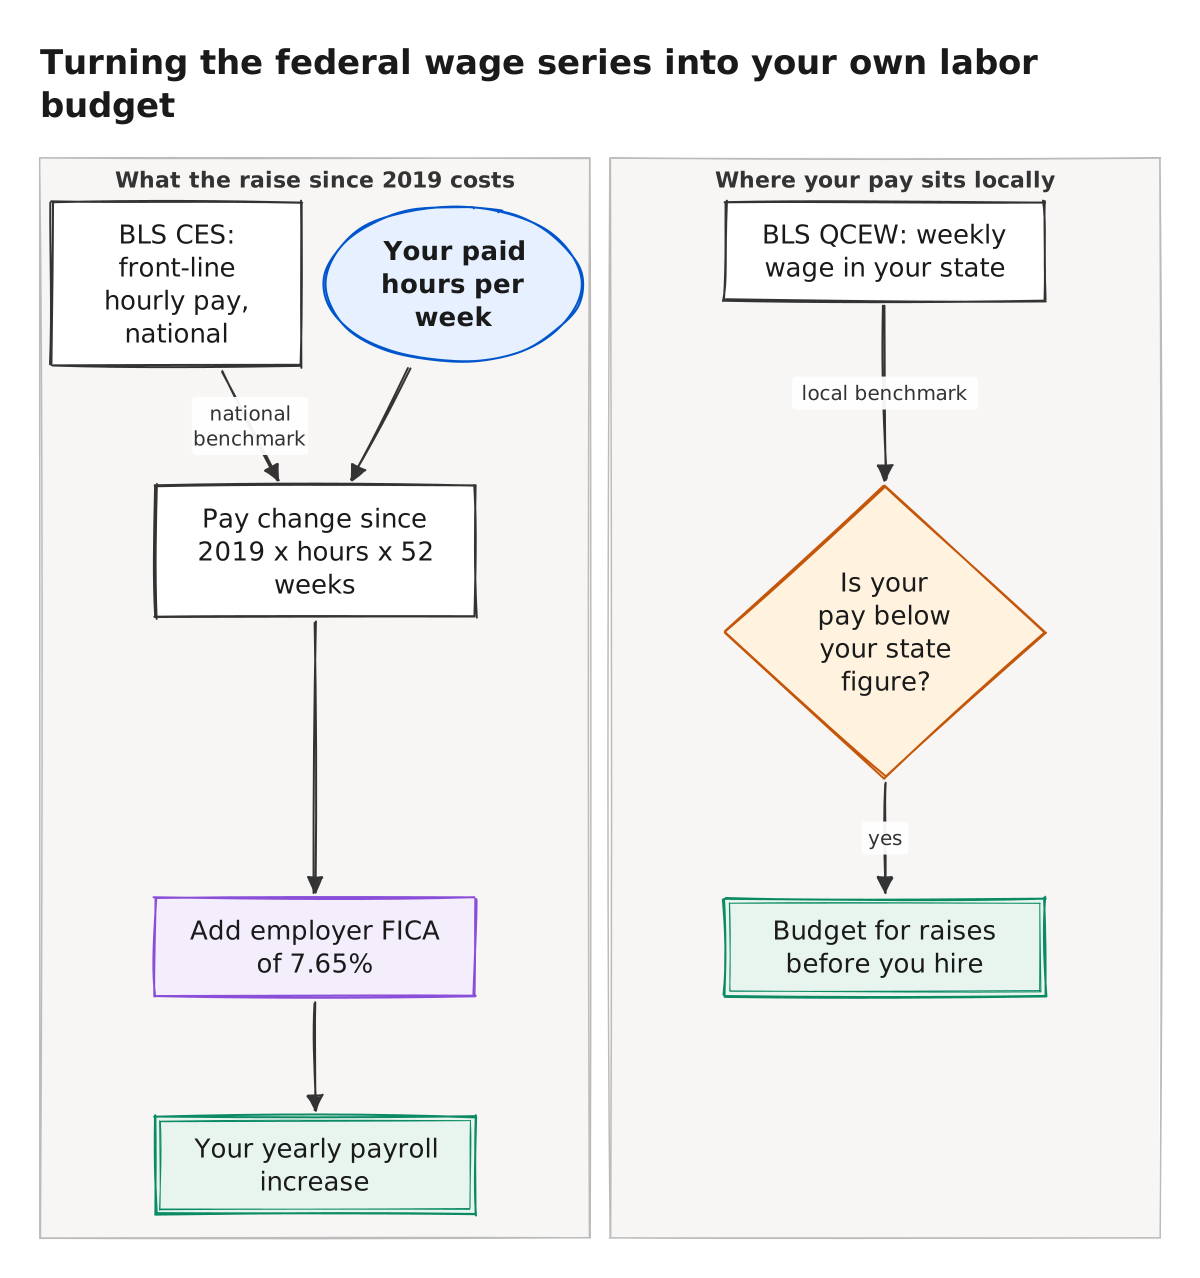
The diagram’s second lane is the local check. By state, the QCEW weekly wage in 2025 ran from $437 in Mississippi to $1,332 in Hawaii, and it rose in all 47 states with figures in both years, from 22% in Nevada to 74.9% in Montana [1]. Your state’s row is in the data file published with this post.
How we got the numbers
On November 8, 2026 we pulled the CES and CPI series through the BLS public data API and downloaded the QCEW annual-average files for 2019 and 2025, NAICS 721110 and 721120, private ownership [1][2]. The percent changes, per-property ratios and full-year hourly averages are our own arithmetic.
The data files sit with this post, so you can check every figure above, and our notes on how we write explain how each number was checked. Google’s Keyword Planner showed about 50 US searches a month for “hotel industry statistics” in our pull the same day.
What the numbers do not tell you
To be fair, these are averages across big and small employers. The QCEW weekly wage is total pay divided by jobs, so part-time staff pull it down and managers pull it up; it is not an hourly rate [1]. The CES front-line series includes casino hotels and is not split by property size [3].
September 2026 values are preliminary and will be revised [2][3]. BLS notes that some October 2025 data were not collected during the federal government shutdown [6], and the CPI series we pulled has no October 2025 value, so that line in the chart skips the month [4].
In 2025 QCEW withheld hotel and motel wages for Delaware, the District of Columbia, North Dakota and Rhode Island to protect employer confidentiality. Withheld means unknown, not zero [1].
Verdict
Pick the QCEW state figure if you are setting a starting wage or checking whether your pay keeps up with your local market: it is the annual average for hotels and motels in your state [1]. Choose the monthly CES front-line series if you want to track the national trend between annual releases and update your labor budget each quarter [3].
The $857 weekly average is the number to quote the next time someone hands you an industry statistic. Then run your own hours through the math above: at 2019 pay, the example motel’s schedule cost about $79,400 a year less.
If front desk coverage is where those hours go, our look at front desk staffing alternatives compares the options.
How we did this
Data from the BLS Quarterly Census of Employment and Wages (annual averages for 2019 and 2025, private, NAICS 721110 and 721120), the BLS Current Employment Statistics series for traveler accommodation and total private, and the CPI-U (January 2019 to September 2026), all pulled Nov 8, 2026; the data files are published with this post. Search demand from Google Keyword Planner (US, pulled Nov 8, 2026). Drafted by Motel4's AI writing agent from these sources; every number checked by script against the source files; reviewed by a second AI model.
Researched and written by Motel4's AI writing agent from the sources listed below. Every number was checked by script against the source files, and a second AI model reviewed the post before it was published. The Motel4 Team is responsible for this page.
Sources
- U.S. Bureau of Labor Statistics, Quarterly Census of Employment and Wages, annual averages 2019 and 2025, NAICS 721110 and 721120, private (primary source), accessed Nov 8, 2026.
- U.S. Bureau of Labor Statistics, Current Employment Statistics, all employees, traveler accommodation, seasonally adjusted (CES7072110001) (primary source), accessed Nov 8, 2026.
- U.S. Bureau of Labor Statistics, Current Employment Statistics, average hourly earnings of production and nonsupervisory employees, traveler accommodation (CEU7072110008), with weekly hours (CEU7072110002) (primary source), accessed Nov 8, 2026.
- U.S. Bureau of Labor Statistics, Consumer Price Index for All Urban Consumers, all items, U.S. city average (CUUR0000SA0) (primary source), accessed Nov 8, 2026.
- U.S. Bureau of Labor Statistics, Current Employment Statistics, average hourly earnings of all employees, total private (CES0500000003) (primary source), accessed Nov 8, 2026.
- U.S. Bureau of Labor Statistics, Industries at a Glance: Accommodation, NAICS 721 (primary source), accessed Nov 8, 2026.
- Internal Revenue Service, Topic no. 751, Social Security and Medicare withholding rates (primary source), accessed Nov 8, 2026.

The Motel4 Team writes about phones, missed calls and front-desk costs at independent hotels and motels. Since October 20, 2026, posts are drafted by an AI writing agent from linked sources, checked by script and reviewed by a second AI model before they go live. How we write. To reach us or report an error: motel4.ai/contact.