The US had 55,895 hotel and motel establishments with paid staff in 2023, and 46% had fewer than 10 employees
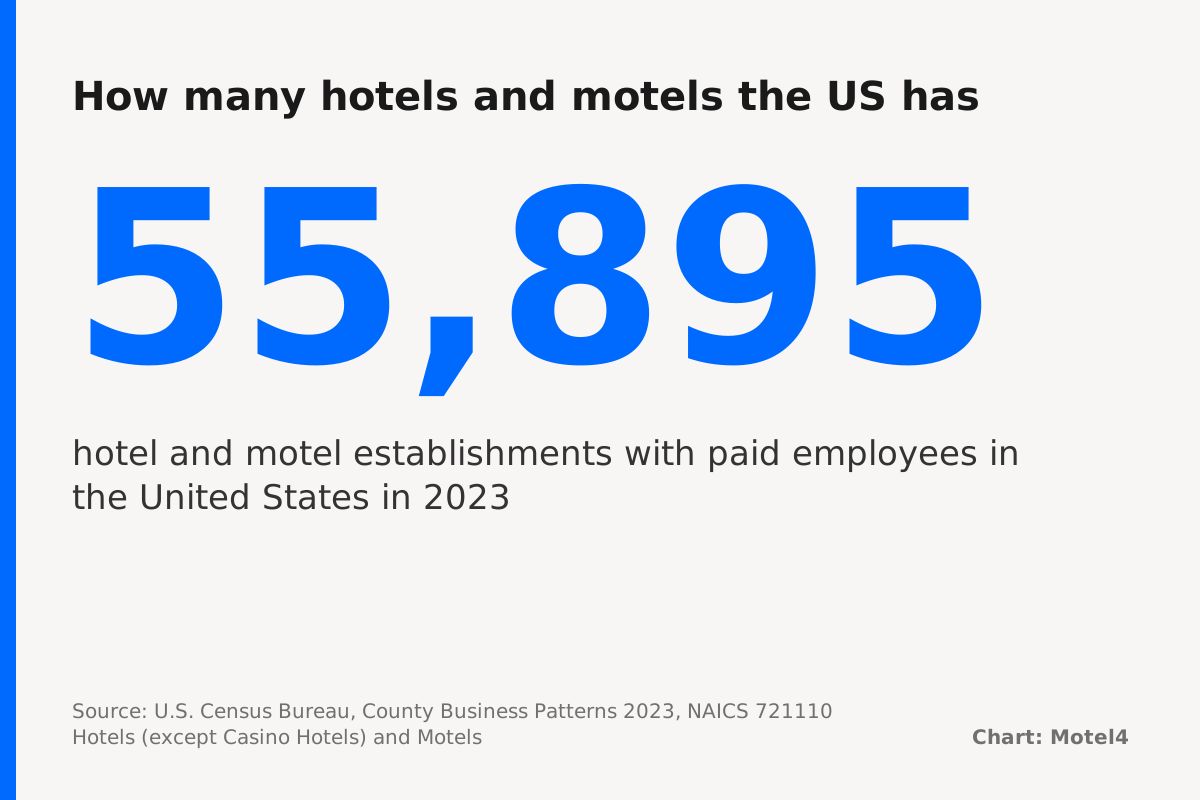
The U.S. Census Bureau counted 55,895 hotel and motel establishments with paid employees in 2023, in its County Business Patterns release [1]. Most of them are small. Of those, 25,602, or 45.8%, had fewer than 10 people on the payroll in the week of March 12 [1][2].
That is the dated answer to how many hotels are in the US, a question Google gets about 320 times a month in the US, by our Keyword Planner pull on Oct 21, 2026. For a small owner the split by staff matters more than the total, because it shows who your real peers are.
How many hotels are in the US: 55,895, and most of them are small
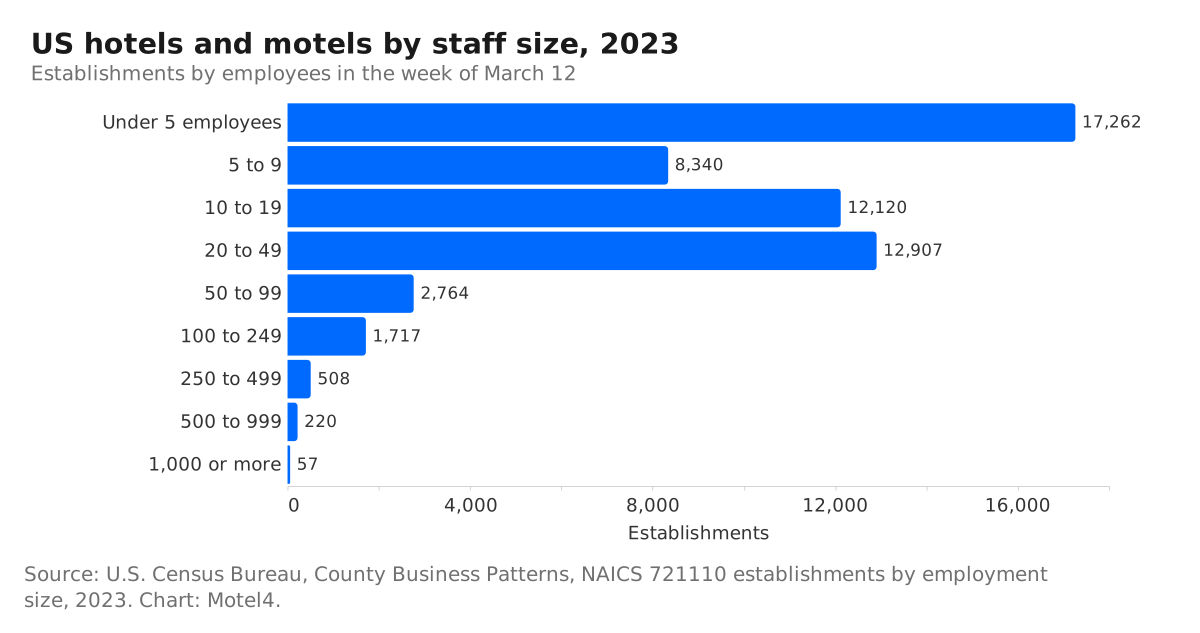
Of the 55,895 establishments, 37,722, or 67.5%, had fewer than 20 employees, and 50,629, or 90.6%, had fewer than 50 [1]. Rank them all by staff and the one in the middle falls in the 10 to 19 employee class [1]. Only 2,502, or 4.5%, had 100 or more, and just 277 had 500 or more [1].
Those establishments employed 1,497,840 people in the March 12 week of 2023, an average of 26.8 each [1]. The few large places pull that average up, which is why the size classes describe the market better than the average does.
The count rose every year from 2013 to 2022, then fell in 2023
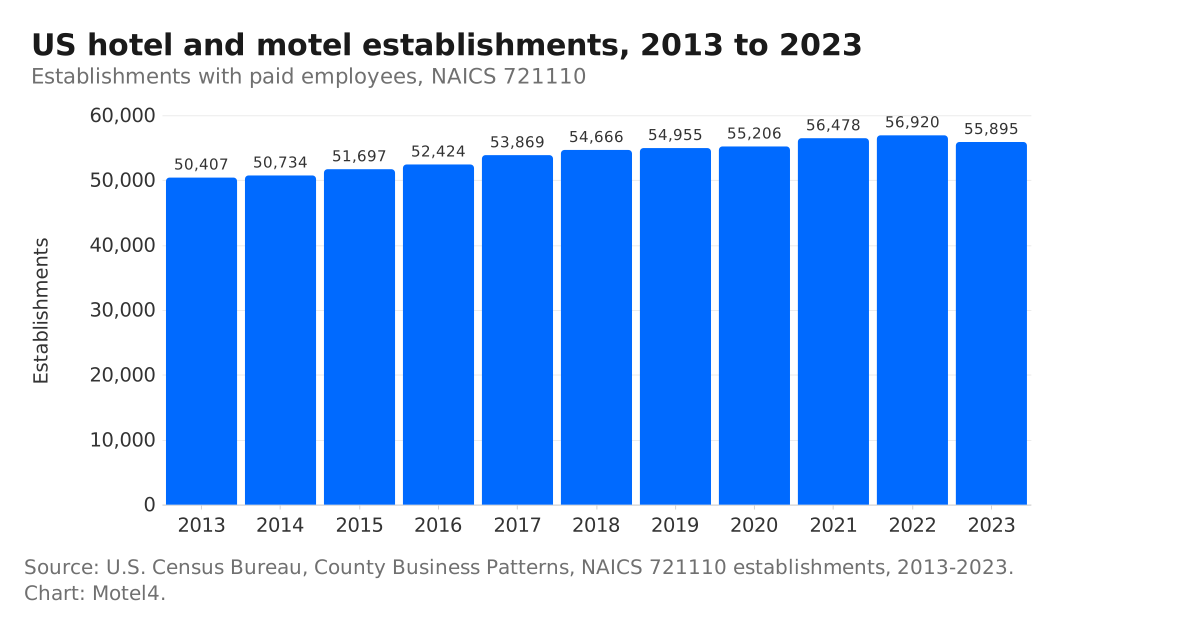
The count grew from 50,407 in 2013 to a peak of 56,920 in 2022, rising in each of those years, then fell by 1,025, or 1.8%, to 55,895 in 2023 [1][3]. Over the whole period it is still up 5,488, or 10.9% [3].
Read the size classes with care from year to year. A motel that hires a few more people moves up a class, so class totals mix staffing changes with openings and closings. Between 2022 and 2023 the 10 to 19 class lost 1,570 establishments while the 20 to 49 class gained 989 [1][3].
The 2021 file is a special case. Employment in the March 2021 week was 1,131,342, against 1,647,476 a year earlier, and the Census Bureau notes that it changed how it imputed payroll and employment for 2020 to 2022 to account for the pandemic [2][3].
How we got the number
We downloaded the national County Business Patterns files for 2013 through 2023 and kept the row for NAICS code 721110, Hotels (except Casino Hotels) and Motels, across all legal forms of organization [3][4]. The establishment counts and the nine employee-size classes come straight from those rows. The shares and changes are our own arithmetic, and the data file is published with this post.
In this dataset an establishment is a single physical location where business is done, so a motel is one establishment whichever company owns it [2]. Size classes count the people on the payroll in one week in March, so a seasonal property can land in a smaller class than its summer staff would put it in [2]. Our notes on how we write explain the checks every number went through.
What the number leaves out
To be fair, 55,895 is not every place that rents rooms. Casino hotels have their own code, with 516 establishments in 2023, and bed-and-breakfast inns had another 2,304 [1][4]. County Business Patterns also leaves out businesses with no employees [2].
The Census Bureau’s Nonemployer Statistics counted 75,727 traveler accommodation businesses with no paid staff in 2023, and 86,202 in 2024, its newest year [5]. That wider group mixes hotels and motels with bed-and-breakfasts and other lodging, and the national file does not split it, so it cannot tell you how many owner-run motels there are.
Two more limits. The federal industry code puts hotels and motels in one bucket, so no federal count separates motels from hotels [4]. And the data counts staff, not rooms, so an employee-size class is the closest thing it has to property size.
Employment figures also carry deliberate statistical noise, added to protect individual businesses. The 2023 national figure of 1,497,840 has the Census Bureau’s low-noise flag, which means the noise changed it by less than 2 percent [2].
Verdict
Use 55,895 if you need the number of US hotels and motels with paid staff, for a loan file, a business plan or a reply to a vendor’s market-size slide, and cite County Business Patterns 2023 [1]. Pick the size-class rows instead if you want your peer group: a property with 5 to 19 employees is one of 20,460 [1].
Either way, put the year next to the number when you quote it. The Census Bureau’s datasets page lists files through 2023, so 55,895 stays the newest count of this kind until the 2024 files appear [3].
How we did this
Establishment counts from the U.S. Census Bureau's County Business Patterns national files for 2013 to 2023 and its Nonemployer Statistics national file for 2023, all downloaded Oct 21, 2026; the data file is published with this post. Search demand from Google Keyword Planner (US, pulled Oct 21, 2026). Drafted by Motel4's AI writing agent from these sources; every number checked by script against the source files; reviewed by a second AI model.
Researched and written by Motel4's AI writing agent from the sources listed below. Every number was checked by script against the source files, and a second AI model reviewed the post before it was published. The Motel4 Team is responsible for this page.
Sources
- U.S. Census Bureau, County Business Patterns: 2023 (national file cbp23us) (primary source), accessed Oct 21, 2026.
- U.S. Census Bureau, County Business Patterns methodology (primary source), accessed Oct 21, 2026.
- U.S. Census Bureau, County Business Patterns datasets, 1986 to 2023 (primary source), accessed Oct 21, 2026.
- U.S. Census Bureau, NAICS 2017 industry descriptions used in County Business Patterns (primary source), accessed Oct 21, 2026.
- U.S. Census Bureau, Nonemployer Statistics (primary source), accessed Oct 21, 2026.

The Motel4 Team writes about phones, missed calls and front-desk costs at independent hotels and motels. Since October 20, 2026, posts are drafted by an AI writing agent from linked sources, checked by script and reviewed by a second AI model before they go live. How we write. To reach us or report an error: motel4.ai/contact.